Published 21 mins ago
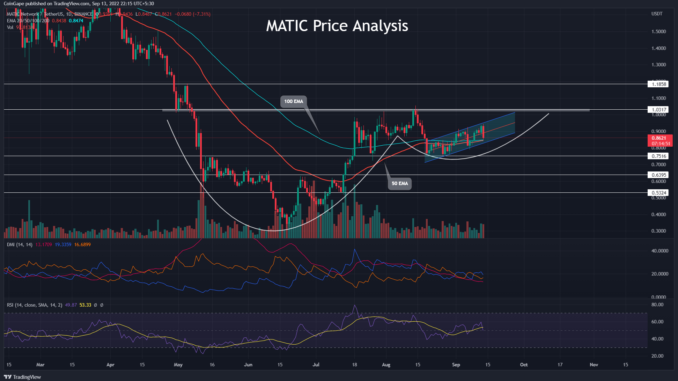
Despite being a bearish pattern, the rising parallel channel led the MATIC price to $1 resistance. Moreover, this resistance is the neckline of a cup and handle pattern holds significant weightage to determine the future market price. Thus, the coin holder should closely watch the price action near the $1 mark.
Key points from MATIC price analysis
The support trendline carries the ongoing recovery in MATIC price
The 50-and-100-day EMA on the verge of bullish crossover may attract more buyers to the market
The intraday trading volume in the MATIC is $748.3 Million, indicating a 24.5% gain

In late August, the MATIC prices took a bullish reversal from the $0.75 support level, resulting in a rising channel pattern, accounting for a 25% jump. As a result, the bull cycle beats the 50-and-100-day EMA but struggles to reach the psychological mark of $1.0.
Taking the larger picture into account, the price action reveals a cup and handle pattern in the daily chart with a neckline at the psychological mark of $1.0. The ongoing bull cycle projects the possibility of pattern completion, which may shortly result in a bullish breakout if the buying pressure sustains.
However, amid today’s sell-off, the MATIC price tumbled 7.3% and shows a bearish engulfing candle in the rising channel.
Coming to the intraday trading volumes, the bearish engulfing candle finds seller commitment, teasing a rising channel fallout. If the prices manage to close below the support trendline, MATIC traders can find a short-term selling opportunity with a target of the $0.75 support level. Furthermore, if the increased selling pressure breaks the $0.75 level, a prolonged correction might test the psychological mark of $0.50.
However, an uptrend continuation reaching the psychological mark of $1.0 will increase the breakout possibility. And the unleashed bullish momentum upon successful breakout can test the overhead resistance of $1.30, accounting for a 30% jump.
Technical Indicators
DMI: due to the recent sell-off, the DI lines reverse sharply, indicating a bearish crossover possibility. And the falling adx line maintains the signal of weak Trend momentum.
Relative Strength Index: A steady growth in daily-RSI slope dips to the halfway line cracking under the 14-day SMA. Hence the Technical indicators maintain a slightly bearish viewpoint for MATIC.
Resistance levels- $1 and $1.18
Support levels-
$0.815 and $0.75
The presented content may include the personal opinion of the author and is subject to market condition. Do your market research before investing in cryptocurrencies. The author or the publication does not hold any responsibility for your personal financial loss.
Close Story


 Bitcoin
  Ethereum
  Tether
  XRP
XRP  Solana
  USDC
USDC  TRON
TRON  Dogecoin
  Cardano
Be the first to comment